Real-Time Analysis Workflow
|
Registration |
Records the location of each cluster on the patterned flow cell. |
|
|
|
|
Intensity extraction |
Determines an intensity value for each cluster. |
|
|
|
|
Phasing correction |
Corrects the effects of phasing and prephasing. |
|
|
|
|
Base calling |
Determines a base call per cycle for every cluster. |
|
|
|
|
Quality scoring |
Assigns a quality score to every base call. |
Registration aligns an image to the rotated square array of nanowells on the patterned flow cell. Because of the ordered arrangement of nanowells, the X and Y coordinates for each cluster in a tile are predetermined. Cluster positions are written to a cluster location (s.locs) file for each run.
If registration fails for any images in a cycle, no base calls are generated for that tile in that cycle.
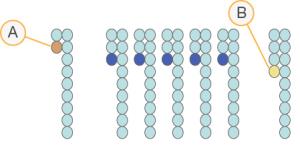
During the sequencing reaction, each DNA strand in a cluster extends by one base per cycle. Phasing and prephasing occurs when a strand becomes out of phase with the current incorporation cycle.
Phasing occurs when a base incorporation falls behind.
Prephasing occurs when a base incorporation jumps ahead.
Phasing and Prephasing

- Read with a base that is phasing
- Read with a base that is prephasing.
RTA3 corrects the effects of phasing and prephasing, which maximizes the data quality at every cycle throughout the run.
Base calling determines a base (A, C, G, or T) for every cluster of a given tile at a specific cycle. The NovaSeq 6000Dx Instrument uses two-channel sequencing, which requires only two images to encode the data for four DNA bases, one image from the green channel and one from the red channel.
A no call is identified as N. No calls occur when a cluster does not pass filter, registration fails, or a cluster is shifted off the image.
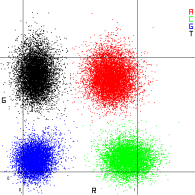
Intensities for each cluster are extracted from the red and green images and compared against each other, which results in four distinct populations. Each population corresponds to a base. The base calling process determines to which population each cluster belongs.
Visualization of Cluster Intensities

|
Base |
Red Channel |
Green Channel |
Result |
|---|---|---|---|
|
A |
1 (on) |
1 (on) |
Clusters that show intensity in both the red and green channels. |
|
C |
1 (on) |
0 (off) |
Clusters that show intensity in the red channel only. |
|
G |
0 (off) |
0 (off) |
Clusters that show no intensity at a known cluster location. |
|
T |
0 (off) |
1 (on) |
Clusters that show intensity in the green channel only. |
During the run, RTA3 filters raw data to remove reads that do not meet the data quality threshold. Overlapping and low-quality clusters are removed.
For two-channel analysis, RTA3 uses a population-based system to determine the chastity (intensity purity measurement) of a base call. Clusters pass filter (PF) when no more than one base call in the first 25 cycles has a chastity below a fixed threshold. When included, PhiX alignment is performed at cycle 26 on a subset of tiles for clusters that passed filter. Clusters that do not pass filter are not base called and not aligned.
A quality score (Q-score) is a prediction of the probability of an incorrect base call. A higher Q-score implies that a base call is higher quality and more likely to be correct. After the Q-score is determined, results are recorded in CBCL files.
The Q-score succinctly communicates small error probabilities. Quality scores are represented as Q(X), where X is the score. The following table shows the relationship between a quality score and error probability.
|
Q-Score Q(X) |
Error Probability |
|---|---|
|
Q40 |
0.0001 (1 in 10,000) |
|
Q30 |
0.001 (1 in 1000) |
|
Q20 |
0.01 (1 in 100) |
|
Q10 |
0.1 (1 in 10) |
Quality scoring calculates a set of predictors for each base call, and then uses the predictor values to look up the Q-score in a quality table. Quality tables are created to provide optimally accurate quality predictions for runs generated by a specific configuration of sequencing platform and version of chemistry.
Quality scoring is based on a modified version of the Phred algorithm.
To generate the Q-table for the NovaSeq 6000Dx Instrument, three groups of base calls were determined, based on the clustering of these specific predictive features. Following grouping of the base calls, the mean error rate was empirically calculated for each of the three groups and the corresponding Q-scores were recorded in the Q-table alongside the predictive features correlating to that group. As such, only three Q-scores are possible with RTA3 and these Q-scores represent the average error rate of the group. Overall, this results in simplified, yet highly accurate quality scoring. The three groups in the quality table correspond to marginal (< Q15), medium (~Q20), and high-quality (> Q30) base calls, and are assigned the specific scores of 12, 26, and 34 respectively. Additionally, a null score of 2 is assigned to any no-calls. This Q-score reporting model reduces storage space and bandwidth requirements without affecting accuracy or performance.
Simplified Q-Scoring with RTA3


