
Quantify DNA (Optional)
This step uses the PicoGreen dsDNA quantification reagent to quantify double-stranded DNA samples. Quantify up to 6 plates, each containing up to 96 samples.
| • | PicoGreen dsDNA quantification reagent |
| • | 1X TE |
| • | Lambda DNA |
| • | 96-well 0.65 ml microplates |
| • | FLUOTRAC 200 96-well flat-bottom plate (1 per standard DNA plate/1 per sample DNA plate) |
| • | Do not use glass containers with PicoGreen. The reagent degrades quickly in the presence of light and can adhere to glass, which lowers its effective concentration in solution and affects the upper response range accuracy. |
| 1. | Prepare the following consumable: |
|
Item |
Storage |
Instructions |
|---|---|---|
|
PicoGreen dsDNA quantification reagent |
2° to 8°C |
Thaw at room temperature for 60 minutes in a light-impermeable container. |
| 2. | Label the 96-well microplate Standard DNA. |
| 3. | Label the FLUOTRAC plates Standard QDNA and Sample QDNA. |
The Sample QDNA plate is for the quantified DNA.
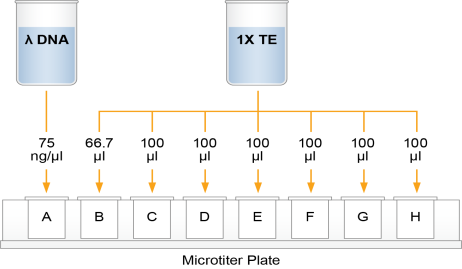
This step creates a Standard DNA plate with serial dilutions of stock Lambda DNA in the wells of column 1.
| 1. | Add stock Lambda DNA to well A1 in the Standard DNA plate and dilute to 75 ng/µl in a final volume of 233.3 µl. Pipette up and down several times to mix. |
| • | Use the following formula to calculate the amount of stock Lambda DNA: |

| • | Dilute the stock DNA in well A1 using the following formula: |

| 2. | Add 66.7 µl 1X TE to well B1. |
| 3. | Add 100 µl 1X TE to the remaining wells of column 1. |
Dilution of Stock Lambda DNA Standard
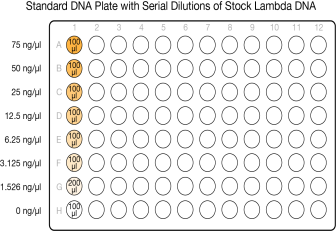
| 4. | Transfer 133.3 µl Lambda DNA from well A1 to well B1. Pipette up and down several times to mix. |
| 5. | Transfer 100 µl from well B1 to well C1. Pipette up and down several times to mix. |
| 6. | Repeat the sequential transfer of 100 µl for wells D1, E1, F1, and G1. |
Do not transfer from well G1 to H1. Well H1 serves as the blank 0 ng/µl Lambda DNA.
|
Row-Column |
Concentration (ng/µl) |
Final Volume in Well (µl) |
|---|---|---|
|
A1 |
75 |
100 |
|
B1 |
50 |
100 |
|
C1 |
25 |
100 |
|
D1 |
12.5 |
100 |
|
E1 |
6.25 |
100 |
|
F1 |
3.125 |
100 |
|
G1 |
1.5262 |
200 |
|
H1 |
0 |
100 |
Serial Dilutions of Lambda DNA
| 7. | Cover the Standard DNA plate with a cap mat. |
In this step, PicoGreen is diluted for use in the subsequent Create Standard QDNA Plate and Create Sample QDNA Plate procedures.
| 1. | Prepare a 1:200 dilution of PicoGreen to 1X TE using a sealable 100 ml or 250 ml Nalgene bottle wrapped in aluminum foil. |
Use the following table to determine the volumes needed for 96-well QDNA plates.
|
Number of QDNA Plates |
PicoGreen (µl) |
1X TE (ml) |
|---|---|---|
|
1 |
115 |
23 |
|
2 |
215 |
43 |
|
3 |
315 |
63 |
| 2. | Cap the foil-wrapped bottle and vortex to mix. |
| 1. | Transfer the PicoGreen/1X TE dilution into a clean reagent reservoir. |
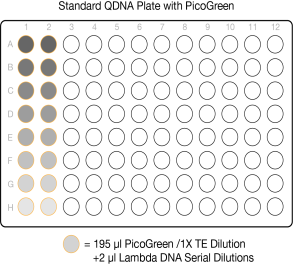
| 2. | Transfer 195 µl PicoGreen/1X TE dilution from the Standard DNA plate to columns 1 and 2 of the Standard QDNA plate. |
| 3. | Transfer 2 µl stock Lambda DNA dilution from the Standard DNA plate to columns 1 and 2 of the Standard QDNA plate. |
Standard QDNA Plate with PicoGreen/ 1xTE Dilution
| 4. | Immediately cover the plate with an adhesive aluminum seal. |
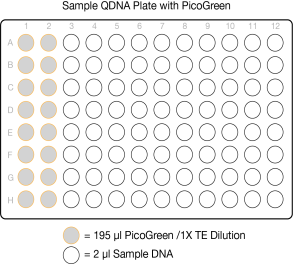
This step compares the Sample QDNA plate data to the standard curve generated by the Standard QDNA plate to obtain the concentration of sample DNA. For best performance, use a minimum concentration of 50 ng/µl.
| 1. | Turn on the spectrofluorometer. |
| 2. | Start the SoftMax Pro application. |
SoftMax Pro screens and menu options can vary based on the software version.
| 3. | Load the Illumina QDNA.ppr file from the installation CD. |
| 4. | Select Protocols | GTS_QDNA. |
| 5. | Load the Standard QDNA plate into the spectrofluorometer tray with well A1 in the upper left corner. |
| 6. | Select Illumina QDNA | SQDNA_STD. |
| 7. | Select Read. |
| 8. | When the spectrofluorometer is finished reading the data, remove the plate from the tray. |
| 9. | Select Standard Curve to view the standard curve graph. |
| 10. | Review generated data and perform one of the following options: |
| • | Accept the data and continue to the next step. |
| • | Repeat the Make a Standard DNA Plate process and regenerate the standard curve. |
| 11. | Load the first Sample QDNA plate in the spectrofluorometer tray with well A1 in the upper left corner. |
| 12. | Select SQDNA, and then select Read. |
| 13. | When the spectrofluorometer is finished reading the data, remove the plate from the tray. |
| 14. | Repeat steps 11–13 to quantify all Sample QDNA plates. |
| 15. | When all plates have been read, select File | Save to save the output data file (*.pda). |
| 16. | Select File | Import/Export | Export and export the file as a *.txt file. |
The *.txt file can be viewed in Microsoft Excel for data analysis.
SAFE STOPPING POINT
If you are stopping, store the plate(s) at 2°C to 8°C for up to 30 days.
