Scan Metrics
This snippet causes dropdowns to open on page load. This text/paragraph does not appear in the output.
The scan metrics for each BeadChip display in the Scan Metrics table at the top of the Review screen. Use the table to review intensity values in the red and green channels, and to check focus and registration metrics for each BeadChip stripe. You can also use the table to determine whether intensity data was normalized for each scanned BeadChip section.
The focus metric ranges between 0 and 1. The higher the focus score, the sharper and more well-defined the bead images are. A low focus score means that the bead images are not well-defined and bead colors bleed into each other.
The registration value varies depending on the type of BeadChip. The value ranges between 0 and 1 (multiple swaths per BeadChip) or between 0 and 2 (single swath per BeadChip). When the stripe registration is < 0.75, the stripe is flagged as potentially misregistered and is colored red in the Scan Progress Indicator window. Misregistered sections can be rescanned.
The AutoConvert column shows one of the following normalization metrics for each scanned BeadChip section:
| • | Converted—The IDAT file for that BeadChip section was converted to a GTC file. The intensity data were normalized and genotype calls were generated. |
| • | N/A—The AutoConvert feature was not enabled for this scan. |
| • | Not Converted—The AutoConvert feature was enabled for this scan, but the IDAT file for that BeadChip section was not converted to a GTC file. |
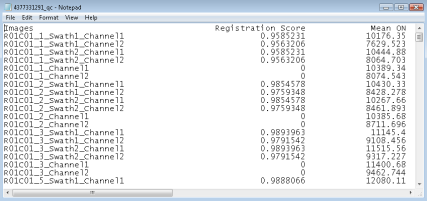
Scan metrics are also stored in two text files, Metrics.txt and [Barcode]_qc.txt, where [Barcode] represents the barcode number for a single BeadChip. If there is a rescan, the scan metrics will transfer the existing data to a new file with a number at the end (eg, Metrics00.txt) and overwrite the data in the Metrics.txt file.
Contents of a [Barcode]_qc.txt Scan Metrics File