
Change Sex Chromosome Parameters
The values for sex chromosome parameters determine the variables that the VeriSeq NIPT RUO uses to complete various equations. These equations create classification ranges for the fetal sex and sex chromosome aneuploidies (SCAs) of samples. Refer to Reporting Settings Minimum and Maximum Threshold Values for parameter descriptions.
The following Sex Chromosome Aneuploidy Threshold graphs visualize these equations, the ranges for different classifications, and the fetal sex chromosome classification process. The process first determines whether chromosome Y is present in a sample (Graph A). Additional thresholds are then applied to identify different SCAs. If chromosome Y is present, then the thresholds for XY, XYY, and XXY (Graph B) determine fetal sex and SCAs. If chromosome Y is absent, then the thresholds for monosomy X (Graph C) and trisomy X (Graph D) are used. Threshold parameters are denoted in the format of rparameter to distinguish them from the condition names on the same graphs.
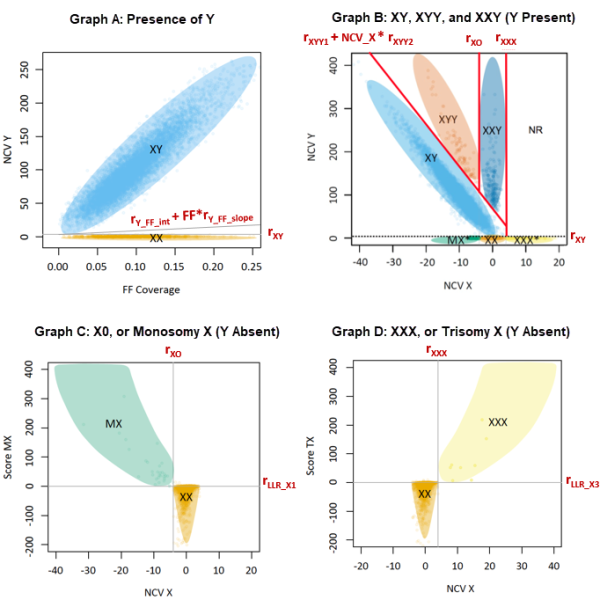
- Plots fetal fraction (FF) coverage versus normalized chromosomal value for Y (NCV_Y). The graph shows the threshold lines to classify samples as having chromosome Y present (XY) or chromosome Y absent (XX).
- Plots normalized chromosomal value for X (NCV_X) versus NCV_Y. The graph shows the thresholds (red lines) for classifying XY, XYY, XXY, or Not Reportable (NR) in samples identified as having chromosome Y present.
- Plots NCV_X versus a score for X0 (Score_MX). The graph shows the thresholds for classifying XX or X0 in samples identified as having chromosome Y absent.
- Plots NCV_X versus a score for XXX (Score_TX). The graph shows the thresholds for classifying XX or XXX in samples identified as having chromosome Y absent.
