Diagnosing Suboptimal Clustering (Patterned Flow Cells)
Patterned flow cells consist of a nanowell substrate with millions or billions of ordered wells. The uniform cluster sizes and spacing increase cluster density and prevent overclustering. Although overclustering is not possible, loading a library with a suboptimal concentration negatively impacts data.
During a run, review the following combination of run metrics to determine whether a patterned flow cell is underloaded, optimal, or overloaded. Depending on the system, metrics are available in Analysis Software (AS) or Run Metrics Software. Some also appear on the instrument monitor after cycle 25.
These metrics can vary by library type and system. The low, medium, and high designations are relative to typical metrics and intended as a general guideline.
|
Metric |
Underloaded |
Optimal |
Overloaded |
|---|---|---|---|
|
%Occupancy¹ |
Low |
High |
High |
|
%PF |
Low |
High |
Low |
|
% ≥ Q30 |
High |
High |
Variable |
|
%Duplicates² |
High |
Medium |
Low |
¹ Available for the iSeq 100 and NovaSeq 6000 Systems only. Some software labels this metric %Occupied.
² When available from your bioinformatics pipeline.
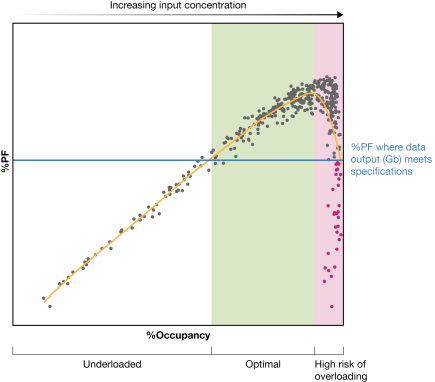
The following figure plots example data points to illustrate the %PF and %Occupancy metrics for underloaded, optimal, and potentially overloaded flow cells. Red dots indicate overloaded flow cells. When reviewing run metrics, reference this figure to help determine optimum loading concentration. Illumina software does not generate plots of this type.
Relationship Between %PF and %Occupancy

