Imaging Metrics
The Imaging tab in Run Metrics Software includes thumbnail images of tiles and detailed run metrics. Imaging metrics are not visible in Analysis Software (AS).
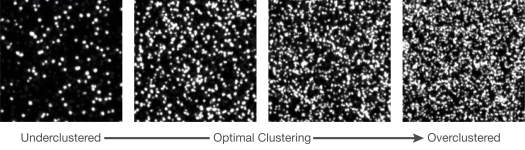
Although not indicative of run quality, thumbnail images are useful for diagnosing clustering issues. Review thumbnail images to determine visually whether a flow cell is underclustered or overclustered. Because one thumbnail image shows one channel, review thumbnails from all channels for a comprehensive representation of the flow cell surface.
The following figure shows example thumbnail images for a range of cluster densities. The actual appearance of cluster density varies by system.
Thumbnail Images of Clusters
By default, the MiniSeq, NextSeq 550, and NextSeq 500 systems do not save thumbnail images. For help turning on this feature, contact Illumina Technical Support.
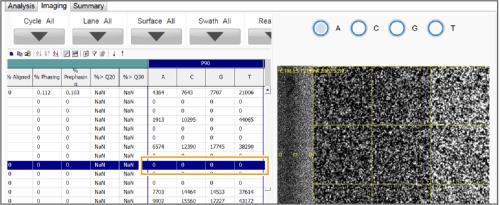
The metrics table, which reports run metrics for each tile, is useful for diagnosing registration issues. The P90 (90th percentile of signal) A, C, G, and T table cells show the intensity values extracted from each cluster:
| • | With optimal clustering, these cells display numeric intensity values > 0. |
| • | With overclustering, these cells display 0 or NaN (not a number) even though the thumbnail images show clusters. This situation indicates that overclustering prevented the software from extracting intensity values. |
Example P90 Values for an Overclustered Flow Cell (MiSeq System)
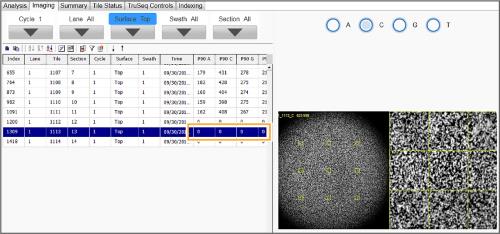
Example P90 Values for an Overclustered Flow Cell (HiSeq 2500 System)