
QC Metrics and Coverage/Callability Reports
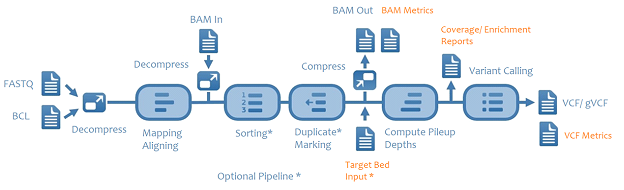
DRAGEN generates pipeline-specific metrics coverage reports during each run. There are four different groups of metrics that are generated at different stages of the pipeline:
| • | Mapping and Aligning metrics |
| • | VCF metrics |
| • | Duration (or run time) metrics |
| • | Coverage (or enrichment) metrics and reports |
The mapping/aligning metrics, VCF metrics, Duration metrics, and a subset of available coverage reports are autogenerated and do not require any activation or specific commands. Additional coverage metrics can be enabled, and additional coverage regions can be specified.
DRAGEN performs metric calculation during analysis so that it does not impact the run time.
Generation of Metrics and Reports
The QC metrics are printed to the standard output and CSV files are written to the run output directory.
| • | <output prefix>.mapping_metrics.csv |
| • | <output prefix>.vc_metrics.csv |
| • | <output prefix>.time_metrics.csv |
| • | <output prefix>.<coverage region prefix>_coverage_metrics.csv |
| • | <output prefix>.<other coverage reports>.csv |
|
Section |
RG/Sample |
Metric |
Count/Ration/Time |
Percentage/Seconds |
|---|---|---|---|---|
|
MAPPING/ALIGNING SUMMARY |
|
Total input reads |
816360354 |
|
|
MAPPING/ALIGNING SUMMARY |
|
Number of duplicate reads (marked not removed) |
15779031 |
1.93 |
|
... |
|
|
|
|
|
MAPPING/ALIGNING PER RG |
RGID_1 |
Total reads in RG |
816360354 |
100 |
|
MAPPING/ALIGNING PER RG |
RGID_1 |
Number of duplicate reads (marked) |
15779031 |
1.93 |
|
... |
|
|
|
|
|
VARIANT CALLER SUMMARY |
|
Number of samples |
1 |
|
|
VARIANT CALLER SUMMARY |
|
Reads Processed |
738031938 |
|
|
... |
|
|
|
|
|
VARIANT CALLER PREFILTER |
SAMPLE_1 |
Total |
4918287 |
100 |
|
VARIANT CALLER PREFILTER |
SAMPLE_1 |
Biallelic |
4856654 |
98.75 |
|
... |
|
|
|
|
|
RUN TIME |
|
Time loading reference |
00:18.6 |
18.65 |
|
RUN TIME |
|
Time aligning reads |
19:24.4 |
1164.42 |
Mapping and aligning metrics, such as the metrics computed by the Samtools Flagstat command, are available on an aggregate level (over all input data), and on a per read group level. Unless explicitly stated, the metrics units are in reads (ie, not in terms of pairs or alignments).
|
Metric |
Description |
|||||||||||||||
|---|---|---|---|---|---|---|---|---|---|---|---|---|---|---|---|---|
|
Total input reads |
Total number of reads in the input FASTQ files. |
|||||||||||||||
|
Number of duplicate marked reads |
Reads marked as duplicates as a result of the --enable-duplicate-marking option being set to true. |
|||||||||||||||
|
Number of duplicate marked and mate reads removed |
Reads marked as duplicates, along with any mate reads that are removed when the --remove-duplicates option is set to true. |
|||||||||||||||
|
Number of unique reads |
Total number of reads minus the duplicate marked reads. |
|||||||||||||||
|
Reads with mate sequenced |
Number of reads with a mate. |
|||||||||||||||
|
Reads without mate sequenced |
Total number of reads minus number of reads with mate sequenced. |
|||||||||||||||
|
QC-failed reads |
Reads that did not pass platform/ vendor quality checks (SAM flag 0x200). |
|||||||||||||||
|
Mapped reads |
Total number of mapped reads minus number of unmapped reads. |
|||||||||||||||
|
Number of unique and mapped reads |
Number of mapped reads minus number of duplicate marked reads. |
|||||||||||||||
|
Unmapped reads |
Total number of reads that could not be mapped. |
|||||||||||||||
|
Singleton reads |
Number of reads where the read could be mapped, but the paired mate could not be read. |
|||||||||||||||
|
Paired reads |
Count of reads in which both reads in the pair are mapped. |
|||||||||||||||
|
Properly paired reads |
Both reads in the pair are mapped and fall within an acceptable range from each other based on the estimated insert length distribution. |
|||||||||||||||
|
Not properly paired reads (discordant) |
The number of paired reads minus the number of properly paired reads. |
|||||||||||||||
|
Paired reads mapped to different chromosomes |
The number of reads with a mate, where the mate was mapped to a different chromosome. |
|||||||||||||||
|
Paired reads mapped to different chromosomes (MAPQ >= 10) |
The number of reads with a MAPQ > 10 and with a mate, where the mate was mapped to a different chromosome. |
|||||||||||||||
|
Reads with indel R1 |
The percentage of R1 reads containing at least 1 indel. |
|||||||||||||||
|
Reads with indel R2 |
The percentage of R2 reads containing at least 1 indel. |
|||||||||||||||
|
Soft-clipped bases R1 |
The percentage of bases in R1 reads that are soft-clipped. |
|||||||||||||||
|
Soft-clipped bases R2 |
The percentage of bases in R2 reads that are soft-clipped. |
|||||||||||||||
|
Mismatched bases R1 |
The number of mismatched bases on R1, which is the sum of SNP count and indel lengths. The metric does not count anything within soft clipping or RNA introns. The metric also does not count a mismatch if either the reference base or read base is N. |
|||||||||||||||
|
Mismatched bases R2 |
The number of mismatched bases on R2, which is the sum of SNP count and indel lengths. The metric does not count anything within soft clipping or RNA introns. The metric also does not count a mismatch if either the reference base or read base is N. |
|||||||||||||||
|
Mismatched bases R1 (excluding indels) |
The number of mismatched bases on R1. The indels lengths are ignored. It does not count anything within soft clipping or RNA introns. The metric also does not count a mismatch if either the reference base or read base is N. |
|||||||||||||||
|
Mismatched bases R2 (excluding indels) |
The number of mismatched bases on R2. The indels lengths are ignored. The metric does not count anything within soft clipping or RNA introns. The metric also does not count a mismatch if either the reference base or read base is N. |
|||||||||||||||
|
Q30 Bases |
The total number of bases with a BQ ≥ 30. |
|||||||||||||||
|
Q30 Bases R1 |
The total number of bases on R1 with a BQ ≥ 30. |
|||||||||||||||
|
Q30 Bases R2 |
The total number of bases on R2 with a BQ >= 30. |
|||||||||||||||
|
Q30 Bases (excluding dups and clipped bases) |
The number of bases on nonduplicate and nonclipped bases with a BQ ≥ 30. |
|||||||||||||||
|
Histogram of reads map qualities |
|
|||||||||||||||
|
Total alignments |
Total number of loci reads aligned to with > 0 quality. |
|||||||||||||||
|
Secondary alignments |
Number of secondary alignment loci. |
|||||||||||||||
|
Supplementary (chimeric) alignments |
A chimeric read is split over multiple loci (possibly due to structural variants). One alignment is referred to as the representative alignment. The other are supplementary. |
|||||||||||||||
|
Estimated read length |
Total number of input bases divided by the number of reads. |
|||||||||||||||
|
Histogram |
||||||||||||||||
|
PCT of bases aligned that fell inside the interval region |
Number of bases inside the interval region and the target region divided by the total number of bases aligned. |
|||||||||||||||
|
Estimated sample contamination |
The estimated fraction of reads in a sample that may be from another human source. |
The prediction accuracy of variant calling is affected by cross-sample contamination. Even small levels of contamination can lead to many FP calls, especially in pipelines where the aim is to detect variants with low allele frequencies.
The DRAGEN cross-sample contamination module uses a probabilistic mixture model to estimate the fraction of reads in a sample that may be from another human source. This sample contamination fraction is estimated as the parameter value in the mixture model that maximizes the likelihood of the observed reads at multiple pile up locations. The mixture model accounts for the population allele frequencies and the inferred sample genotypes.
To enable this metric in germline mode, you must provide the file path on the command line to a VCF that includes marker sites (RSIDs) with population allele frequencies.
--qc-cross-cont-vcf /opt/edico/config/sample_cross_contamination_resource_[hg19 or GRCh37 or GRCh38].vcf
In somatic mode the contamination algorithm first tries to avoid biases that could be introduced by CNV or LoH. The algorithm also estimates nucleotide noise from the sample to adjust for FFPE samples.
To enable somatic contamination detection, use the following setting.
--qc-somatic-contam-vcf /opt/edico/config/somatic_sample_cross_contamination_resource_[hg19 or GRCh37 or GRCh38].vcf.gz
The VCF resource files that are included with DRAGEN can be reconstructed from the Ensembl database. The VCF files included in the DRAGEN config folder contain ~5000 marker locations where the population AFs are close to 0.5. The files are reference-specific (hg19/GRCh37/hg38). DRAGEN will abort if an incompatible resource and reference file is used (eg, CRCh37 resource file and hg19 reference).
The following shows example output for a sample with 1.1% estimated contamination. This value is provided as a fraction, so a value of 0.011 is the same as 1.1%.
MAPPING/ALIGNING SUMMARY Estimated sample contamination 0.011
In somatic tumor-normal mode, the mapping and aligning metrics are generated separately for the tumor and normal samples, with each line beginning with TUMOR or NORMAL to indicate the sample. The metrics for the tumor sample are output first, followed by the metrics for the normal sample. Metrics per read group are also separated into tumor and normal read groups.
In somatic tumor-only mode, the mapping and aligning metrics follow the same conventions as germline mode, without metrics labeled as TUMOR or NORMAL.
The generated variant calling metrics are similar to the metrics computed by RTG vcfstats. Metrics are reported for each sample in multi sample VCF and gVCF files. Based on the run case, metrics are reported either as standard VARIANT CALLER or JOINT CALLER. Metrics are reported both for the raw (PREFILTER) and hard filtered (POSTFILTER) VCF file.
Panel of Normals (PON) and COSMIC filtered variants are counted as PASS variants in the POSTFILTER VCF metrics. These PASS variants can cause higher than expected variant counts in the POSTFILTER VCF metrics.
|
Metric |
Description |
|---|---|
|
Number of samples |
Number of samples in the population/ joint VCF. |
|
Reads Processed |
The number of reads used for variant calling, excluding any duplicate marked reads and reads falling outside of the target region. |
|
Total |
The total number of variants (SNPs + MNPs + indels). |
|
Biallelic |
Number of sites in a genome that contains two observed alleles. The reference is counted as one allele, which allows for one variant allele. |
|
Multiallelic |
Number of sites in the VCF that contain three or more observed alleles. The reference is counted as one, which allows for two or more variant alleles. |
|
SNPs |
A variant is counted as an SNP when the reference, allele 1, and allele 2 are all length 1. |
|
Insertions (Hom) |
Number of variants that contains homozygous insertions. |
|
Insertions (Het) |
Number of variants where both alleles are insertions, but not homozygous. |
|
Deletions (Het) |
Number of variants that contains homozygous deletions. |
|
INDELS (Het) |
Number of variants where genotypes are either [insertion+deletion], [insertion+SNP], or [deletion+SNP]. |
|
De Novo SNPs |
De novo marked SNPs with DQ > 0.05. Set the --qc-snp-denovo-quality-threshold option to the required threshold. The default is 0.05. |
|
De Novo INDELs |
De novo marked indels with DQ values > 0.02. This DQ threshold can be specified by setting the --qc-indel-denovo-quality-threshold option to the required DQ threshold. The default is 0.02. |
|
De Novo MNPs |
De novo marked SNPs with DQ > 0.05. Set the --qc-snp-denovo-quality-threshold to the required threshold. The default is 0.05. |
|
(Chr X SNPs)/(Chr Y SNPs) ratio in the genome (or the target region) |
Number of SNPs in chromosome X (or in the intersection of chromosome X with the target region) divided by the number of SNPs in chromosome Y (or in the intersection of chromosome Y with the target region). If there was no alignment to either chromosome X or chromosome Y, this metric shows as NA. |
|
SNP Transitions |
An interchange of two purines (A<->G) or two pyrimidines (C<->T). |
|
SNP Transversions |
An interchange of purine and pyrimidine bases Ti/Tv ratio: ratio of transitions to transitions. |
|
Heterozygous |
Number of heterozygous variants. |
|
Homozygous |
Number of homozygous variants. |
|
Het/Hom ratio |
Heterozygous/ homozygous ratio. |
|
In dbSNP |
Number of variants detected that are present in the dbSNP reference file. If no dbSNP file is provided via the --bsnp option, then both the In dbSNP and Novel metrics show as NA. |
|
Novel |
Total number of variants minus number of variants in dbSNP. |
|
Percent Callability |
Available in germline and somatic modes with gVCF output. The percentage of non-N reference positions having a PASSing genotype call. Multiallelic variants are not counted. Deletions are counted for all the deleted reference positions only for homozygous calls. Only autosomes and chromosomes X, Y, and M are considered. |
|
Percent Autosome Callability |
Only autosomes are considered. |
|
Percent QC Region Callability in Region i (i is equivalent to regions 1, 2, or 3) |
Available if callability for custom regions is requested via the --qc-coverage-region-i option and the callability output is specified with --qc-coverage-reports-i. All contigs are considered. |
When the germline small variant caller is executed, DRAGEN calculates a per het/hom ratio per contig. DRAGEN reports the ratios for both the raw (PREFILTER) and hard-filtered (POSTFILTER) VCF. The metrics are output to the .vc_hethom_metrics.csv file. The file contains the following values for each primary contig processed.
| • | Contig |
| • | Number of heterozygous variants |
| • | Number of homozygous variants |
| • | Het/Hom ratio |
The following example shows a section of the metrics.
VARIANT CALLER POSTFILTER,HG04070,1 Heterozygous,185733
VARIANT CALLER POSTFILTER,HG04070,1 Homozygous,182928
VARIANT CALLER POSTFILTER,HG04070,1 Het/Hom ratio,1.015
VARIANT CALLER POSTFILTER,HG04070,2 Heterozygous,203946
VARIANT CALLER POSTFILTER,HG04070,2 Homozygous,174294
VARIANT CALLER POSTFILTER,HG04070,2 Het/Hom ratio,1.170
VARIANT CALLER POSTFILTER,HG04070,3 Heterozygous,192861
VARIANT CALLER POSTFILTER,HG04070,3 Homozygous,130087
VARIANT CALLER POSTFILTER,HG04070,3 Het/Hom ratio,1.483
VARIANT CALLER POSTFILTER,HG04070,4 Heterozygous,178389
VARIANT CALLER POSTFILTER,HG04070,4 Homozygous,157062
VARIANT CALLER POSTFILTER,HG04070,4 Het/Hom ratio,1.136
You can use the het/hom ratio values as an indication of whole chromosome uniparental disomy (UPD). UPD of certain chromosomes are associated with genetic syndromes known as imprinting disorders. Whole chromosome UPD have het/hom ratios close to 0.0. Ranges vary, but are usually between 1.0–2.0. Make sure you are interpreting het/hom ratios in the context of your own sequencing data.
The duration metrics section includes a breakdown of the run duration for each process. For example, the following metrics are generated for the mapper and variant caller pipeline:
| • | Time loading reference |
| • | Time aligning reads |
| • | Time sorting and marking duplicates |
| • | Time DRAGStr calibration |
| • | Time partial reconfiguration |
| • | Time variant calling |
| • | Total run time |
