
Monitor the Run
During sequencing, you can monitor a rund in detail from the MCS Sequencing screen on the instrument.
Other options for monitoring a run include:
| • | Sequencing Analysis Viewer (SAV) installed on an external computer independent of the instrument computer. A network connection is required. For more information, refer to Sequencing Analysis Viewer. Alternatively, if you are connected to BaseSpace Sequence Hub, the run can be monitored using (SAV in BaseSpace Sequence Hub. |
| • | Local Run Manager for monitoring the run remotely if the instrument is connected to the same network. Local Run Manager shows run progress and sequencing information (Total Clusters, % Clusters PF, Read 1 and Read 2%>= Q30, and Last Scored Cycle). For more information, refer to Local Run Manager Software. |
Monitor a run from MCS as follows.
| 1. | On the instrument Sequencing screen, monitor run progress, intensities, and quality scores. |
| • | Run Progress—Shows run progress in a status bar and lists the number of cycles completed. |
| • | Intensity—Shows the value of cluster intensities of the 90th percentile for each tile. |
The graphic in the Intensity area represents the number of tiles and number of surfaces being imaged.
| • | If the flow cell is imaged on the top surface only, a single-column graphic appears. |
| • | If the flow cell is imaged on the top surface and bottom surface, a two-column graphic appears. |
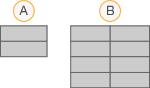
- Indicates two tiles, top surface only
- Indicates four tiles, top and bottom surface
| • | Q-Score All Cycles—Shows the average percentage of bases greater than Q30, which is a quality score (Q-score) measurement. A Q-score is a prediction of the probability of a wrong base call. Q-scores are calculated after cycle 25. |
|
Q-score |
Probability of Wrong Base Call |
|---|---|
|
Q40 |
1 in 10,000 |
|
Q30 |
1 in 1,000 |
|
Q20 |
1 in 100 |
|
Q10 |
1 in 10 |
| • | Cluster Density (K/mm²)—Shows the number of clusters per square millimeter for the run. |
| • | Clusters Passing Filter (%)—Shows the percentage of clusters passing filter based on the Illumina chastity filter, which measures quality. This data appears only after cycle 25. |
| • | Estimated Yield (Mb)—Shows the projected number of bases called for the run, measured in megabases. This data appears only after cycle 25. |
| 2. | When the run is complete, |
The Sequencing screen remains viewable until Next is selected. After you select Next, it is not possible to return to the Sequencing screen.
| 3. | Select Next |
