
Monitor Run Progress
Monitor run progress, intensities, and quality scores as metrics appear on the screen.
Sequencing Run Progress and Metrics
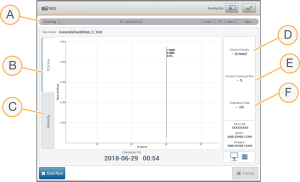
- Run progress—Shows the current step and number of cycles completed for each read. The progress bar is not proportional to the run rate of each step. Use the time remaining in the upper-right corner to determine actual duration.
- Q-score—Shows the distribution of quality scores (Q-scores).
- Intensity—Shows the value of cluster intensities of the 90th percentile for each tile. Plot colors indicate each base: red is A, green is C, blue is G, and black is T. Colors match base indicators used in the Sequencing Analysis Software (SAV).
- Cluster Density (K/mm²)—Shows the number of clusters detected for the run.
- Clusters Passing Filter (%)—Shows the percentage of clusters passing filter.
- Estimated Yield (Gb)—Shows the number of bases projected for the run.
After you select Home, it is not possible to return to view run metrics. However, run metrics are accessible on BaseSpace Sequencing Hub or viewable from a standalone computer using the Sequencing Analysis Viewer (SAV).
